Performance
Arneb is measured against Trino on the 22 TPC-H queries, with both engines run the same way: a coordinator plus two workers in containers with the same per-node CPU cap, reading the same Snappy Parquet from the same object store through the same Hive Metastore. Correctness is a separate gate: every query is compared cell by cell against Trino, and all 22 match at both scale factors below.
| Scale | Protocol | Release | Latency (Trino ÷ Arneb, geomean) | Peak memory (Arneb ÷ Trino, mean) | Faster on |
|---|---|---|---|---|---|
| SF10 | warm | v0.1.2 | 2.3× | 0.14× | 22 / 22 |
| SF10 | cold | v0.1.2 | 4.6× | 0.14× | 22 / 22 |
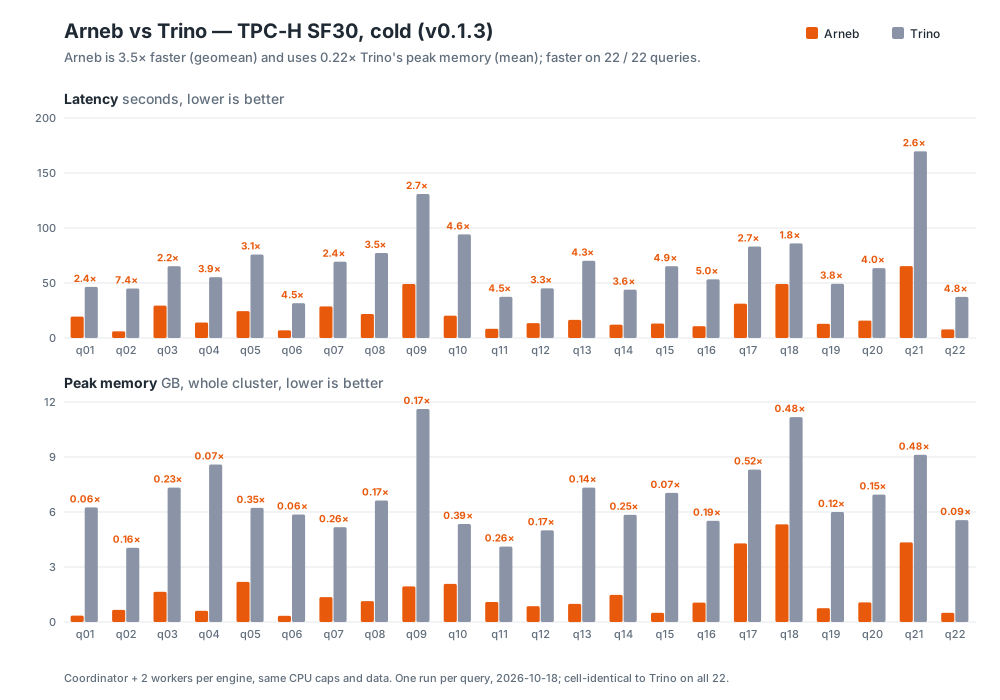
| SF30 | cold | v0.1.3 | 3.5× | 0.22× | 22 / 22 |
Quote the warm SF10 column. A cold run recreates the cluster, so Trino's figure includes the JVM re-JITting its code, a start-up cost Arneb does not have: warming is worth a median 56% to Trino and 9% to Arneb at SF10.
SF10
Measured 2026-10-14 on one host (10 CPUs, 15.66 GiB of container-runtime memory) from the code released as v0.1.2. lineitem is 59,986,052 rows. Latency is in milliseconds and peak memory in MB; memory is the largest simultaneous resident set summed across all three nodes, from the warm run.
| Query | cold arneb | cold Trino | cold | warm arneb | warm Trino | warm | mem arneb | mem Trino | mem | |
|---|---|---|---|---|---|---|---|---|---|---|
q01 | Pricing Summary | 2,068 | 6,309 | 3.1× | 1,852 | 2,678 | 1.4× | 357 | 6,089 | 0.06× |
q02 | Minimum Cost Supplier | 638 | 5,749 | 9.0× | 492 | 2,017 | 4.1× | 346 | 3,812 | 0.09× |
q03 | Shipping Priority | 2,338 | 8,276 | 3.5× | 2,147 | 4,001 | 1.9× | 1,905 | 6,126 | 0.31× |
q04 | Order Priority Checking | 1,425 | 7,014 | 4.9× | 1,264 | 3,157 | 2.5× | 669 | 6,607 | 0.10× |
q05 | Local Supplier Volume | 2,363 | 7,983 | 3.4× | 1,997 | 3,829 | 1.9× | 1,115 | 5,761 | 0.19× |
q06 | Forecasting Revenue | 765 | 4,595 | 6.0× | 698 | 1,890 | 2.7× | 321 | 4,525 | 0.07× |
q07 | Volume Shipping | 2,041 | 8,052 | 3.9× | 1,889 | 4,574 | 2.4× | 1,202 | 7,590 | 0.16× |
q08 | National Market Share | 2,930 | 9,285 | 3.2× | 2,759 | 5,212 | 1.9× | 1,585 | 7,101 | 0.22× |
q09 | Product Type Profit | 4,909 | 11,184 | 2.3× | 4,625 | 6,193 | 1.3× | 1,732 | 8,489 | 0.20× |
q10 | Returned Item Reporting | 2,180 | 10,307 | 4.7× | 2,188 | 4,477 | 2.0× | 939 | 5,976 | 0.16× |
q11 | Important Stock ID | 762 | 5,355 | 7.0× | 694 | 2,192 | 3.2× | 265 | 3,349 | 0.08× |
q12 | Shipping Modes | 1,202 | 6,311 | 5.3× | 1,078 | 2,575 | 2.4× | 436 | 5,504 | 0.08× |
q13 | Customer Distribution | 1,657 | 7,418 | 4.5× | 1,454 | 4,020 | 2.8× | 447 | 5,668 | 0.08× |
q14 | Promotion Effect | 1,463 | 6,909 | 4.7× | 1,201 | 3,008 | 2.5× | 924 | 5,034 | 0.18× |
q15 | Top Supplier | 1,145 | 6,846 | 6.0× | 1,033 | 3,351 | 3.2× | 403 | 6,680 | 0.06× |
q16 | Parts/Supplier Relationship | 1,056 | 7,220 | 6.8× | 988 | 2,283 | 2.3× | 534 | 4,088 | 0.13× |
q17 | Small-Quantity-Order Revenue | 3,042 | 10,746 | 3.5× | 2,969 | 5,559 | 1.9× | 1,377 | 8,746 | 0.16× |
q18 | Large Volume Customer | 4,174 | 10,818 | 2.6× | 4,094 | 6,070 | 1.5× | 2,221 | 10,889 | 0.20× |
q19 | Discounted Revenue | 1,587 | 7,577 | 4.8× | 1,339 | 3,209 | 2.4× | 671 | 5,302 | 0.13× |
q20 | Potential Part Promotion | 1,384 | 8,651 | 6.2× | 1,254 | 3,738 | 3.0× | 806 | 5,532 | 0.15× |
q21 | Suppliers Who Kept Orders Waiting | 3,255 | 15,275 | 4.7× | 3,413 | 6,976 | 2.0× | 1,067 | 7,624 | 0.14× |
q22 | Global Sales Opportunity | 878 | 5,558 | 6.3× | 803 | 2,186 | 2.7× | 320 | 4,638 | 0.07× |
| aggregate | 4.6× | 2.3× | 0.14× |
Latency aggregates are geometric means; the memory aggregate is an arithmetic mean.
Memory, in absolute terms
The five largest gaps at SF10:
| Query | Arneb | Trino | Saved |
|---|---|---|---|
q18 Large Volume Customer | 2.2 GB | 10.6 GB | 8.5 GB |
q17 Small-Quantity-Order Revenue | 1.3 GB | 8.5 GB | 7.2 GB |
q09 Product Type Profit | 1.7 GB | 8.3 GB | 6.6 GB |
q21 Suppliers Who Kept Orders Waiting | 1.0 GB | 7.4 GB | 6.4 GB |
q07 Volume Shipping | 1.2 GB | 7.4 GB | 6.2 GB |
At idle, before any query, Trino's three-node cluster holds 1.99 GB of committed heap (1.84–2.15 GB across 44 restarts); Arneb's holds 0.07 GB.
SF30, cold
Measured 2026-10-18 on a separate benchmark host, cold protocol only, one run per query, from the code released as v0.1.3. Latency is in seconds; memory is the simultaneous cluster peak in GB (KiB ÷ 10⁶), with Trino's derived from the recorded ratio, so it is good to about 2%. The oracle was 22/22 clean, deterministic over two runs. Numbers from this host are not comparable with the SF10 table.
| Query | Arneb (s) | Trino (s) | Latency | Arneb (GB) | Memory | |
|---|---|---|---|---|---|---|
q01 | Pricing Summary | 19.5 | 46.5 | 2.4× | 0.35 | 0.06× |
q02 | Minimum Cost Supplier | 6.1 | 45.0 | 7.4× | 0.66 | 0.16× |
q03 | Shipping Priority | 29.5 | 65.3 | 2.2× | 1.65 | 0.23× |
q04 | Order Priority Checking | 14.1 | 55.3 | 3.9× | 0.61 | 0.07× |
q05 | Local Supplier Volume | 24.5 | 75.9 | 3.1× | 2.19 | 0.35× |
q06 | Forecasting Revenue | 7.0 | 31.6 | 4.5× | 0.34 | 0.06× |
q07 | Volume Shipping | 28.7 | 69.4 | 2.4× | 1.36 | 0.26× |
q08 | National Market Share | 21.8 | 77.3 | 3.5× | 1.14 | 0.17× |
q09 | Product Type Profit | 49.1 | 130.9 | 2.7× | 1.94 | 0.17× |
q10 | Returned Item Reporting | 20.3 | 94.2 | 4.6× | 2.08 | 0.39× |
q11 | Important Stock ID | 8.4 | 37.5 | 4.5× | 1.09 | 0.26× |
q12 | Shipping Modes | 13.5 | 45.2 | 3.3× | 0.86 | 0.17× |
q13 | Customer Distribution | 16.5 | 70.2 | 4.3× | 0.99 | 0.14× |
q14 | Promotion Effect | 12.1 | 43.9 | 3.6× | 1.48 | 0.25× |
q15 | Top Supplier | 13.2 | 65.3 | 4.9× | 0.50 | 0.07× |
q16 | Parts/Supplier Relationship | 10.7 | 53.4 | 5.0× | 1.06 | 0.19× |
q17 | Small-Quantity-Order Revenue | 31.2 | 83.2 | 2.7× | 4.29 | 0.52× |
q18 | Large Volume Customer | 49.1 | 86.0 | 1.8× | 5.33 | 0.48× |
q19 | Discounted Revenue | 12.9 | 49.3 | 3.8× | 0.75 | 0.12× |
q20 | Potential Part Promotion | 15.8 | 63.5 | 4.0× | 1.07 | 0.15× |
q21 | Suppliers Who Kept Orders Waiting | 65.4 | 169.7 | 2.6× | 4.34 | 0.48× |
q22 | Global Sales Opportunity | 7.8 | 37.4 | 4.8× | 0.50 | 0.09× |
| aggregate | 3.5× | 0.22× |
The v0.1.2 run on 2026-10-15 got 3.7× and 0.21×. This release adds no performance work, and the difference is inside run-to-run noise. The second half of that earlier run was also slowed for both engines by the host: Trino's own q21 took 207 s, against 170 s here.
The chart is drawn from the run's data by benchmarks/tpch/scripts/plot_comparison.py, which reads any run_memory_bench CSV:
python3 benchmarks/tpch/scripts/plot_comparison.py \
    benchmarks/tpch/results/memory_total_<stamp>.csv --mode cold \
    -o chart.svg --title "Arneb vs Trino — TPC-H SF30, cold"
What changed in v0.1.3
v0.1.3 is about running Arneb safely next to other workloads, not about speed:
- Security: TLS on pgwire and on the Trino listener (HTTPS), password authentication on both against the same users, and a shared secret plus TLS on the coordinator–worker Flight RPC. See Authentication, TLS and Securing the Cluster.
- Admission control: a cap on running queries with a queue behind it, a per-query memory limit on every node,
statement_timeout, and cancellation that reaches the workers. See Admission Control. - Memory accounting: Parquet scans now count their decode buffers in the memory pool, so the per-query limit and a join's spill decision see the real usage. In the run above, no join spilled earlier because of it; arneb's median peak was 0.97× that of the run before the change.
- Exchange resilience: a worker-to-worker broadcast read that breaks on the transport (for example an h2
BrokenPipeunder many concurrent queries) is reopened and resumed from the first row not yet delivered, instead of failing the query.
What changed in v0.1.2
The largest wins in this release came from the semi and anti joins (EXISTS, NOT EXISTS, IN subqueries):
- Hash-partitioned semi/anti joins. Both sides are partitioned on the join key across the workers, instead of one worker receiving the whole build and probe side. At SF10 warm this took q21 −21%, q04 −22% and q22 −20%.
- Probe-side key-set filters. When the build side of a partitioned semi/anti join is large (estimated ≥ 20M rows and ≥ 4× the probe side), each join task reads the small side first and publishes its keys, as a Bloom filter above 20K keys, to the scans on the big side, which drop non-matching rows before the shuffle. q21 went from losing to Trino (0.8×) to 2.0× at SF10 warm, and q22's SF30 peak memory fell from about 1.75 GB to 0.52 GB. The filter is not attached when the small side itself scans more than 100M rows, since the big side would mostly be read before the keys arrived; that is the case for q21 at SF30.
- q18 builds the smaller join side and runs its
IN-subquery final aggregate in parallel across workers. - Decorrelated aggregates under a semi join are pre-filtered by the outer key set.
Every one of these is on by default, with an ARNEB_* variable to switch it off for A/B comparisons; see Query Engine Levers.
Limits
- One host and one run per protocol per query for each table. Repeated SF10 runs put run-to-run noise at a median of 4–6% per query (worst 29%), so single-query differences under about 30% are not results.
q18's peak memory at SF10 varied between 2.0 and 4.7 GB across the runs above (one worker peaked at about twice the other); it has not recurred since the dataset was re-seeded, and the seed now writes a fixed layout (#126).- SF30 has not been measured warm.
Reproduce it
git clone https://github.com/formosa-ventures/arneb.git && cd arneb

docker compose -f docker-compose.yml \
               -f docker/arneb-bench/docker-compose.bench.yml build

./benchmarks/tpch/scripts/run_benchmark.sh --scenario=sf10 --mode=both
python3 benchmarks/tpch/scripts/blast_radius_oracle.py --runs 2
The method (engine rotation, how memory is sampled, host floors) is described in the README, and the full harness guide is in benchmarks/tpch/README.md.